Introduction
At all levels of detail, diagrams in the Marketing, Strategy, and Sales style help viewers understand business concepts, processes, or a vision for a solution.
The templates below provide an example set of diagrams for a fictional retail commerce implementation of Salesforce. The examples start with a view of business capabilities and highest level product positioning. The example diagrams at each following level zoom in on a more specific aspect of the vision in this highest level diagram. As you move from higher levels to lower levels, the example diagrams show greater amounts of specific detail with increasingly narrow areas of focus. The most granular details appear in the final diagram, which is an example data flow for a specific business process.
Learn more about Salesforce diagram styles and levels by visiting How to Build Salesforce Diagrams.
Level 1: The Big Picture
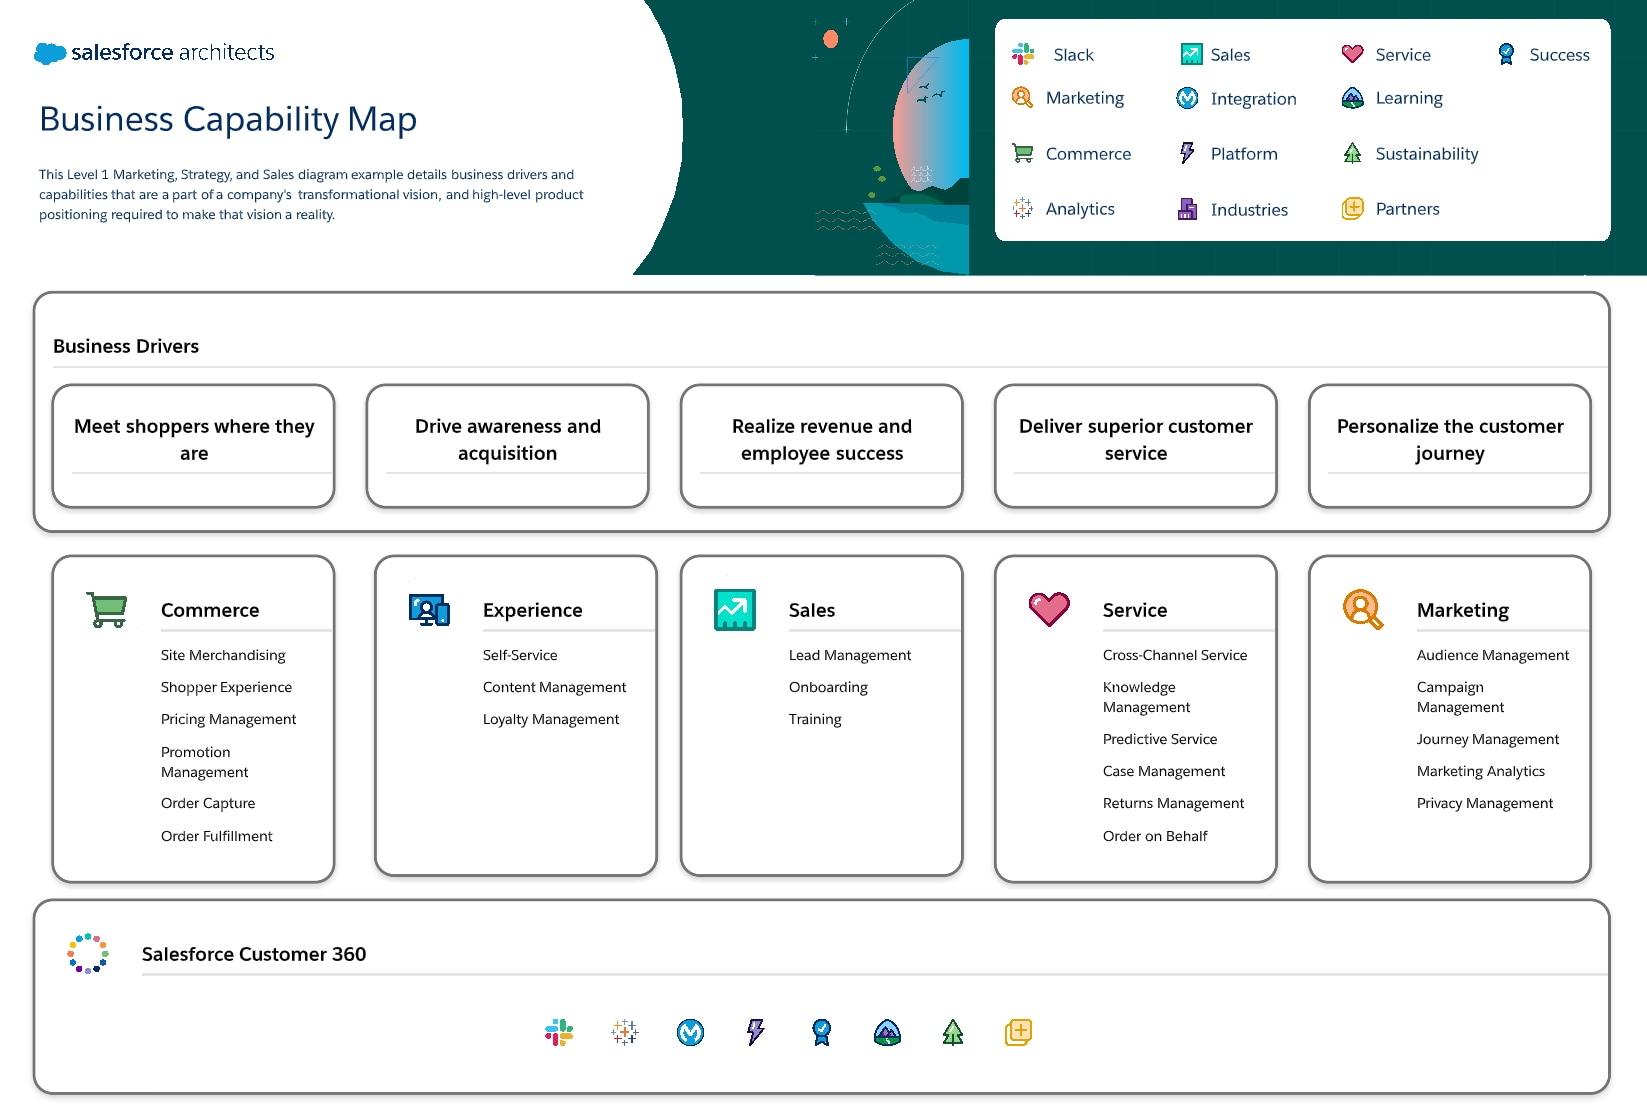
At this level, diagrams show the "art of the possible" or a digital transformation scenario. Diagrams at this level most effectively show business capabilities and high level product positioning, but don't show many details. The focus of these diagrams is to clearly convey the 'big picture' without overwhelming a viewer.
In the Documentation and Implementation style, this highest level view is typically a system landscape. For this style, the highest level view is often a business capability map.
The sample business capability map diagram below shows the vision for a retail commerce digital transformation project, indicating the mix of Salesforce products and capabilities that come together in the overall project vision.
 Open in Lucidchart (Lucidchart account required)
Copy template in Google Slides format (Google account required) Download template in PowerPoint (.pptx) format

Level 2: Piece of the Whole
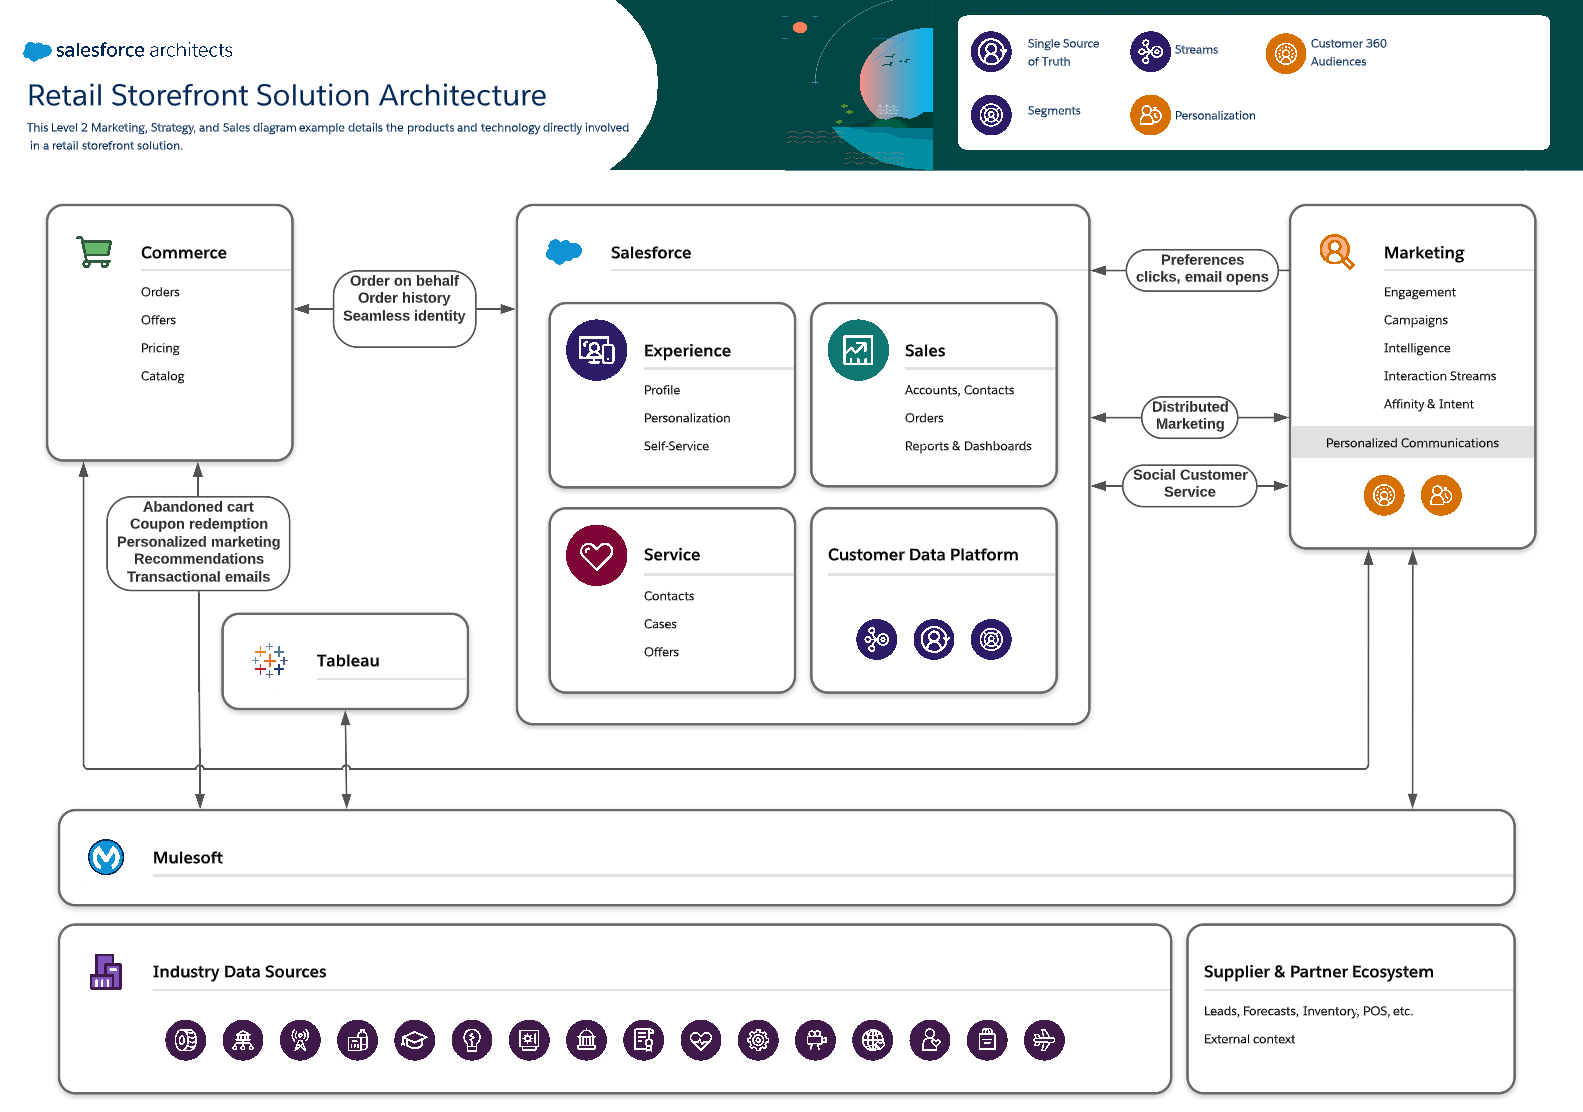
Diagrams at level 2 show a single business capability or solution overview. These diagrams show a specific technology or product subset, unlike the diagrams at the level above. This narrower focus also means diagrams at this level can better support a bit more detail about system capabilities or relationships between entities. This level cannot support fine-grained detail, however, unlike diagrams at lower levels.
Continuing with our retail commerce solution, the level 2 diagram example shows the order on behalf solution architecture. We only see the products and technology directly involved in this capability. We also see supporting relationships at a high level. We don't see specific details about the relationships or their behavior. That level of detail is best supported by diagrams in the levels below.
 Open in Lucidchart (Lucidchart account required)
Copy template in Google Slides format (Google account required) Download template in PowerPoint (.pptx) format
Level 3: Process or Interaction View
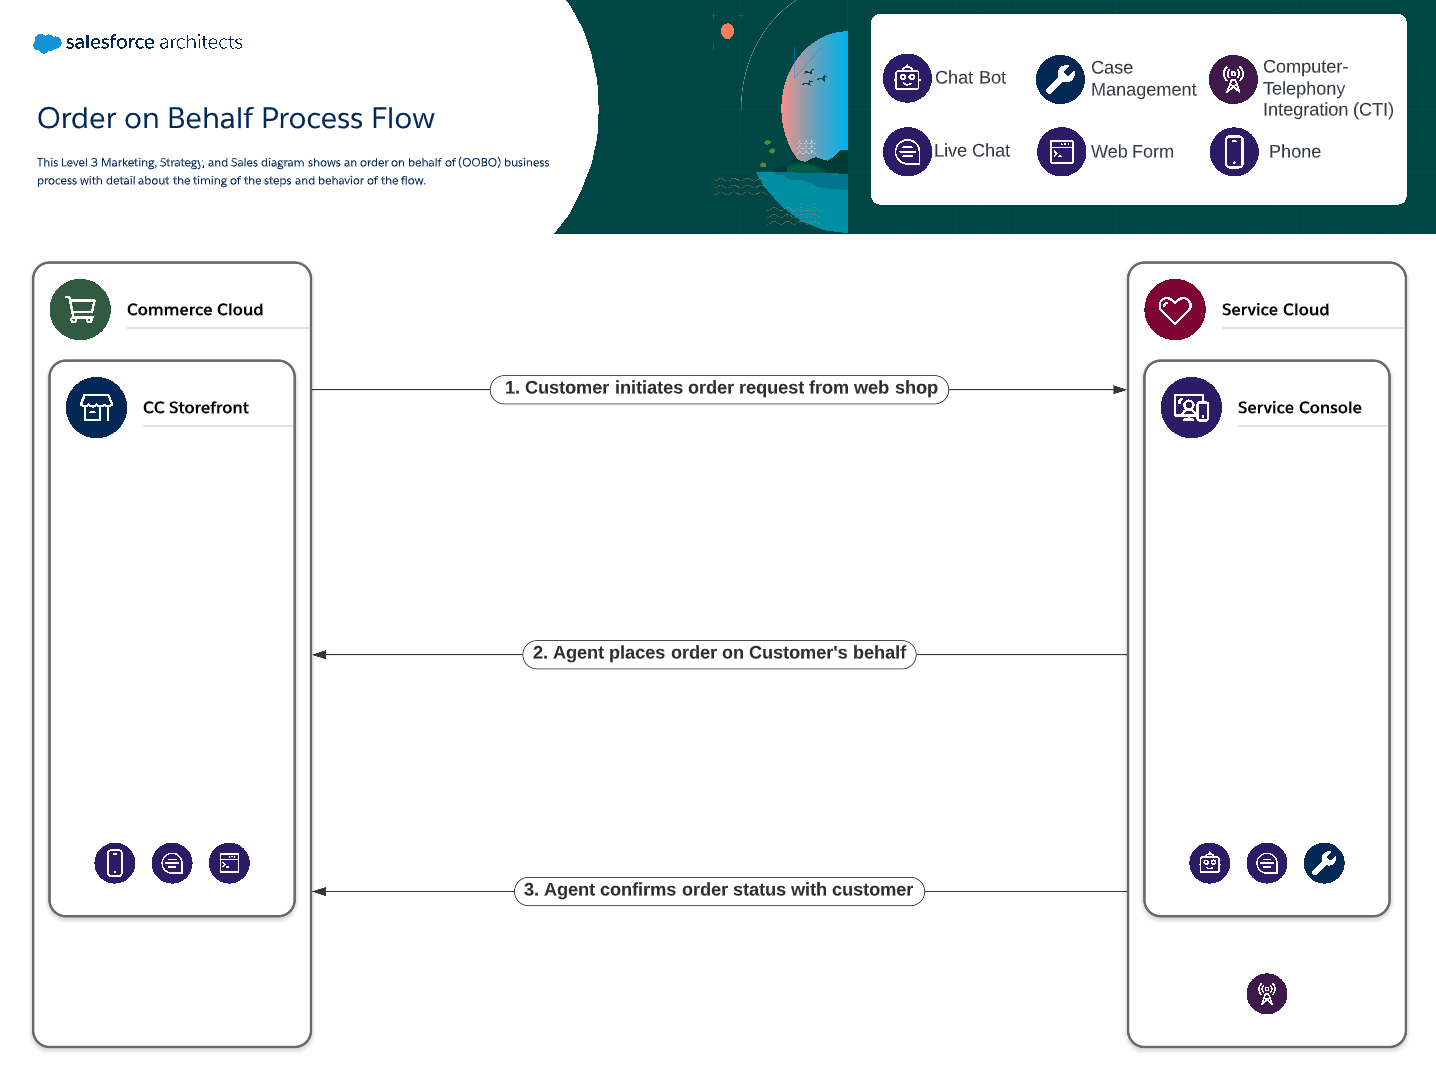
Diagrams at this level show finer details than diagrams at either of the levels above. Diagrams at Level 3 might show personas, input channels, time-based interactions or specific details about behaviors at each step in a process.
In our retail commerce example, the level 3 diagram shows the process flow involved in order on behalf scenarios. This process flow only shows the technology directly involved in the process, with greater details about the order of the steps and relevant business detail about the behavior of the flow.
 Open in Lucidchart (Lucidchart account required)
Copy template in Google Slides format (Google account required) Download template in PowerPoint (.pptx) format
Level 4: The Double Click
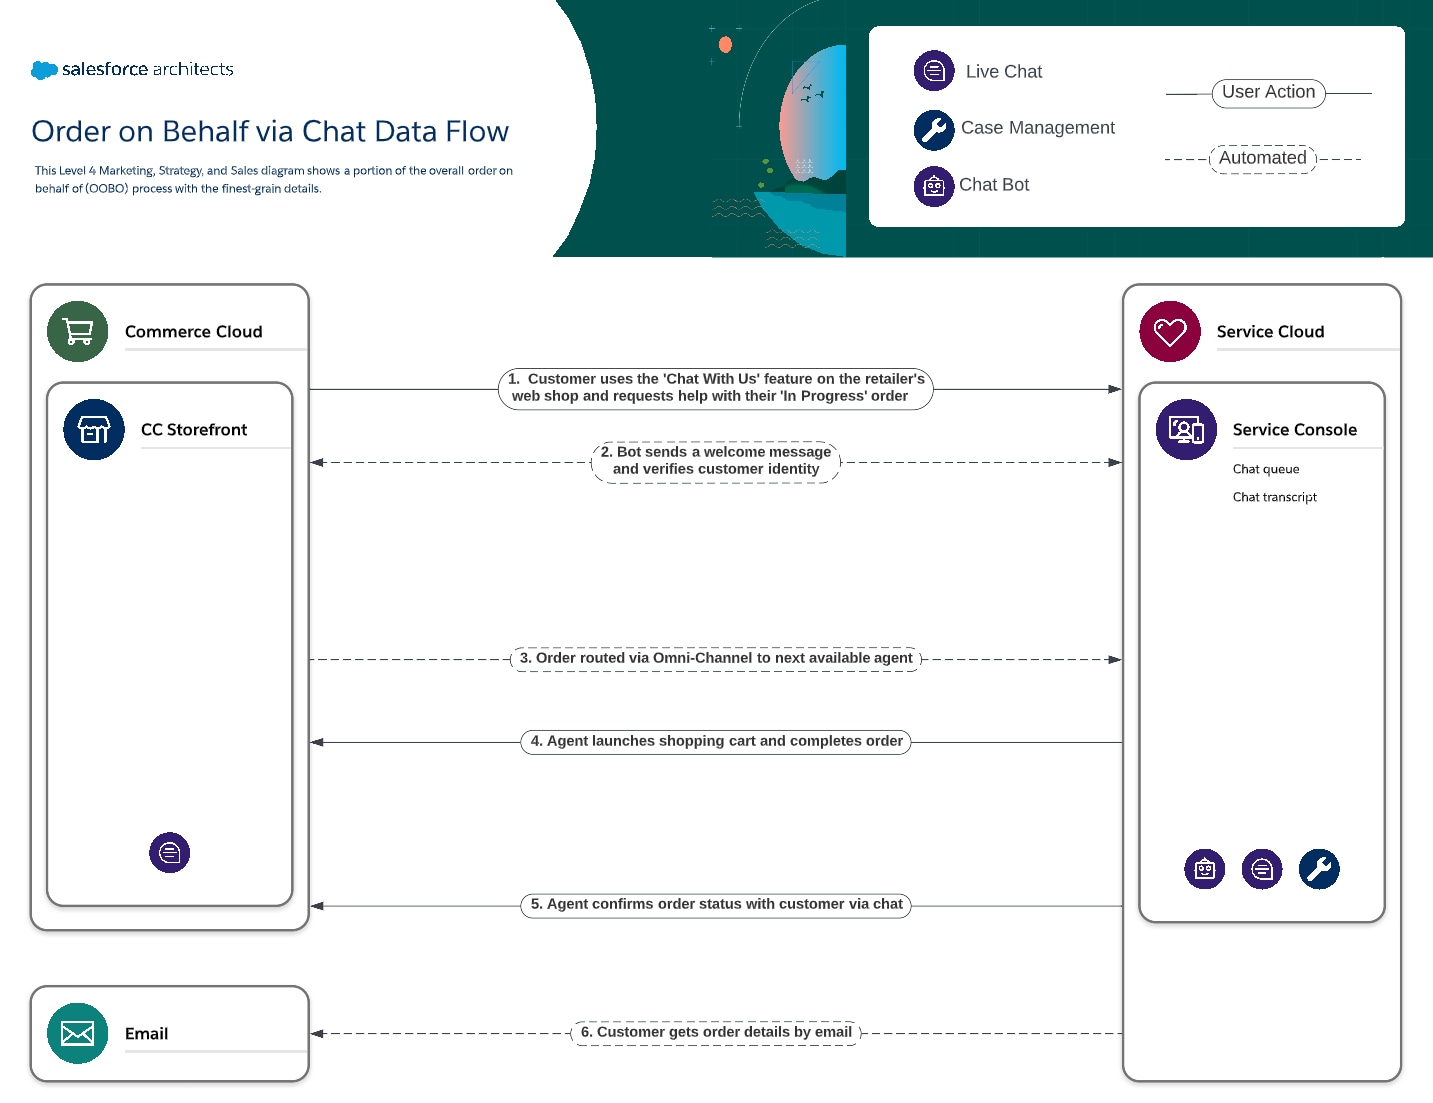
Diagrams at this level show the most detail. This level is the most effective at showing a specific type or portion of a business process, process flow, or user flow. Level 4 diagrams should be the most limited in terms of scope, so the greater level of detail shown is still understandable for a viewer. Level 4 diagrams should give project stakeholders and delivery teams a clear understanding of design requirements—potentially enough to begin writing user stories.
Continuing with our retail commerce example, the level 4 diagram shows a portion of the order on behalf process shown at level 3. However, at this level, the diagram just shows the order on behalf process via a chat-based channel. You'll see fine-grained details important for understanding this single process, such as data flow.
 Open in Lucidchart (Lucidchart account required)
Copy template in Google Slides format (Google account required) Download template in PowerPoint (.pptx) format