Introduction
At all levels of detail, diagrams in the Documentation & Implementation style help viewers understand an implementation or product-related technical details.
The templates below provide an example set of diagrams for a fictional B2C Commerce implementation of Salesforce. The examples start with a view of the overall solution, captured in the form of a system landscape. The example diagrams at each following level zoom in on a more specific aspect of the implementation or system. As you move from higher levels to lower levels, the example diagrams show greater amounts of specific detail with increasingly narrow areas of focus. The most granular details appear in the final diagram.
Learn more about Salesforce diagram styles and levels by visiting How to Build Salesforce Diagrams.
Level 1: The Big Picture
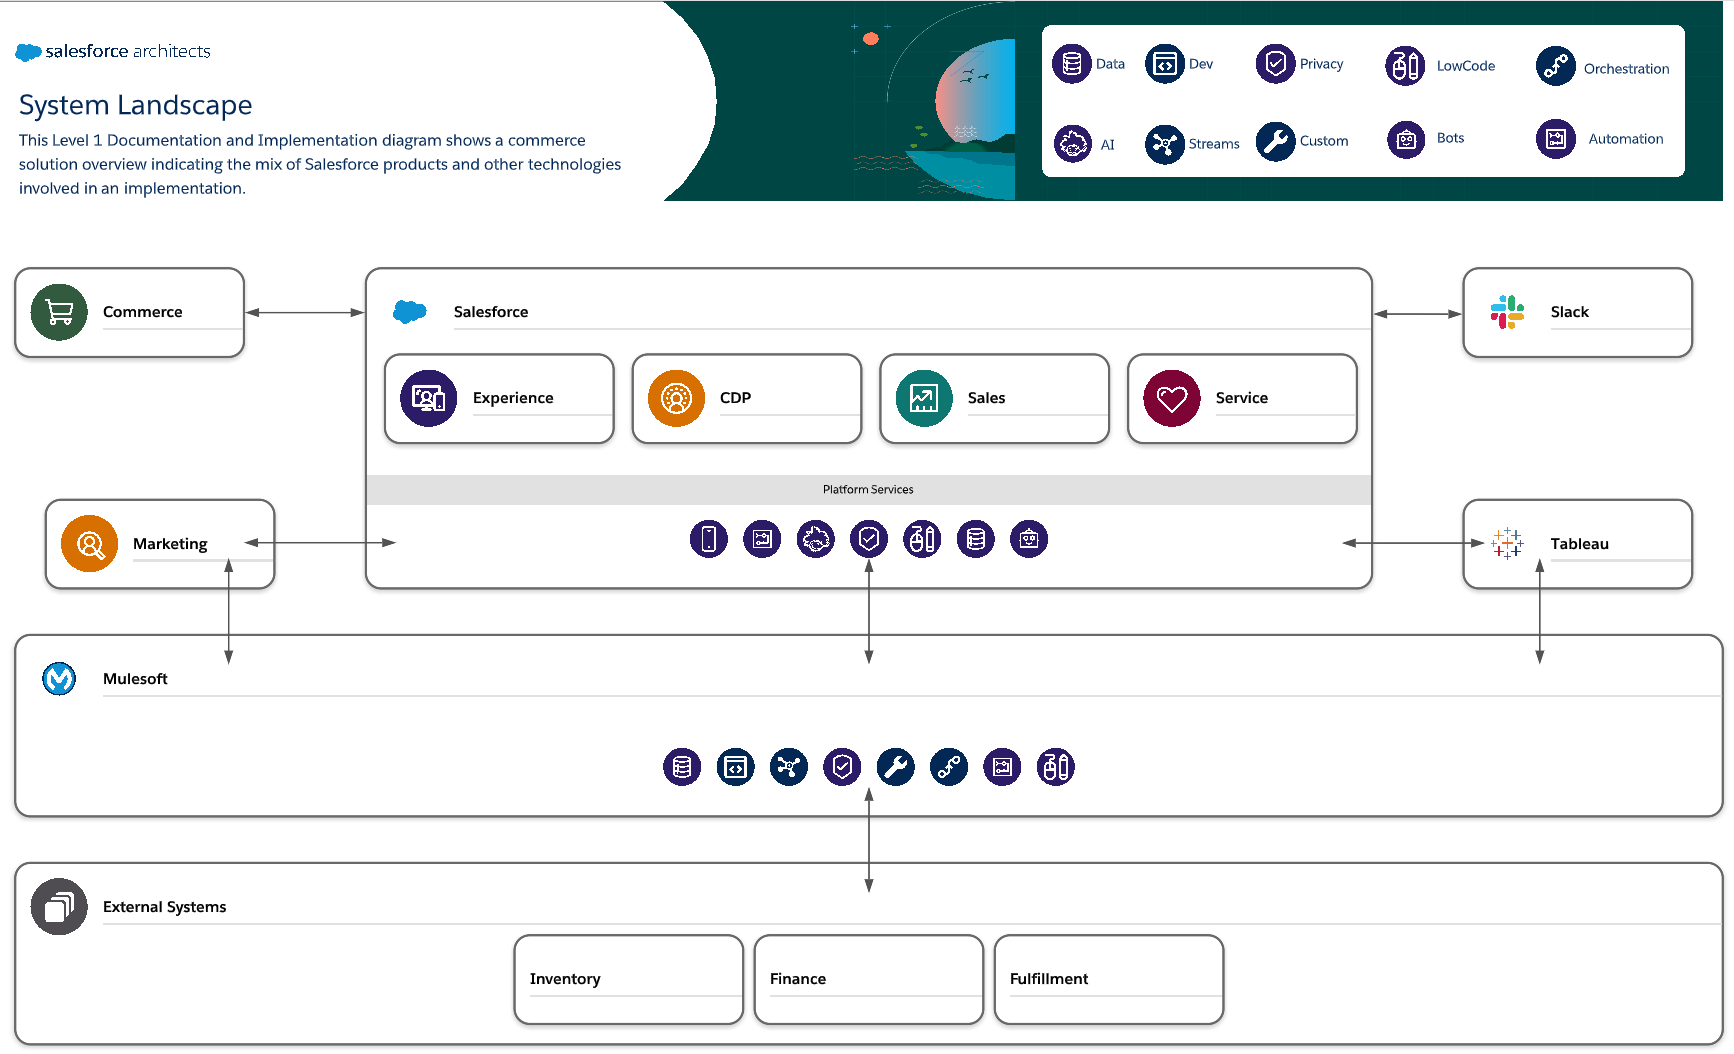
At this level, diagrams show a wider view of a system landscape or solution. Diagrams at this level most effectively show the products or technologies involved a specific solution or implementation, but don't show many details. The focus of these diagrams is to clearly convey the 'big picture' without overwhelming a viewer.
The sample system landscape below shows a B2C commerce solution overview, indicating the mix of Salesforce products and other technologies involved in an implementation.
 Open in Lucidchart (Lucidchart account required)
Copy template in Google Slides format (Google account required) Download template in PowerPoint (.pptx) format

Level 2: Piece of the Whole
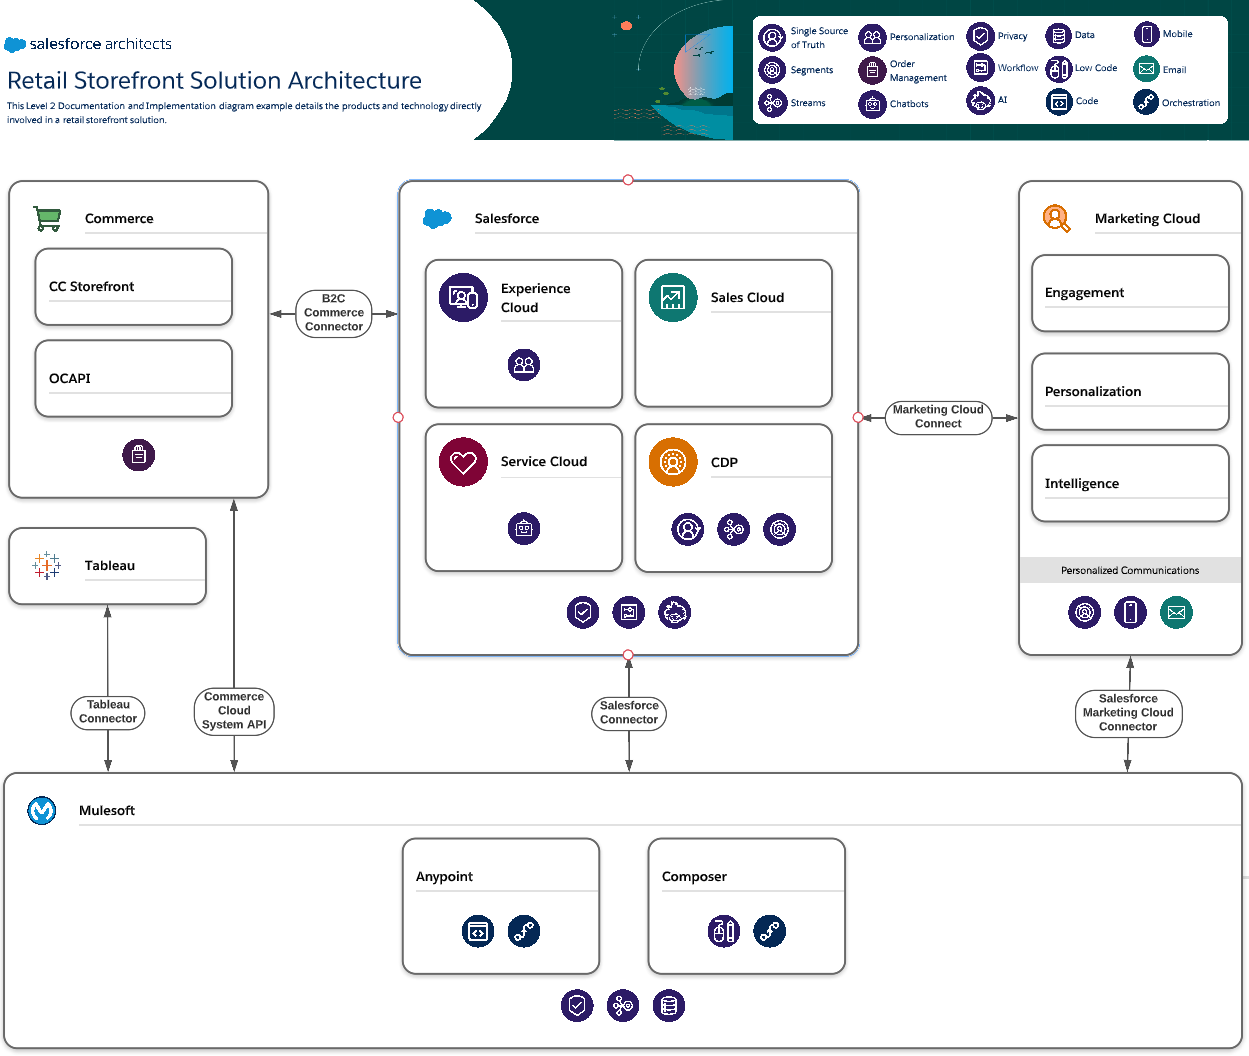
Similar to the level above, diagrams at Level 2 show aspects of a solution overview or system landscape. At this level, however, users wouldn't see an entire system or solution landscape. These diagrams show a more focused subset of products or technologies involved in a solution, with added detail that a higher level diagram can't support. Examples of the details you might see at this level include key integration points or the general direction of data flows.
Continuing with our B2C commerce solution, the level 2 diagram example shows the retail storefront solution architecture. We only see the products and technology directly involved in this layer. We also see more details about integration behavior and key functionality. We don't see time-based interactions or data flows. That level of detail is best supported by diagrams in the levels below.
 Open in Lucidchart (Lucidchart account required)
Copy template in Google Slides format (Google account required) Download template in PowerPoint (.pptx) format

Level 3: Process or Interaction View
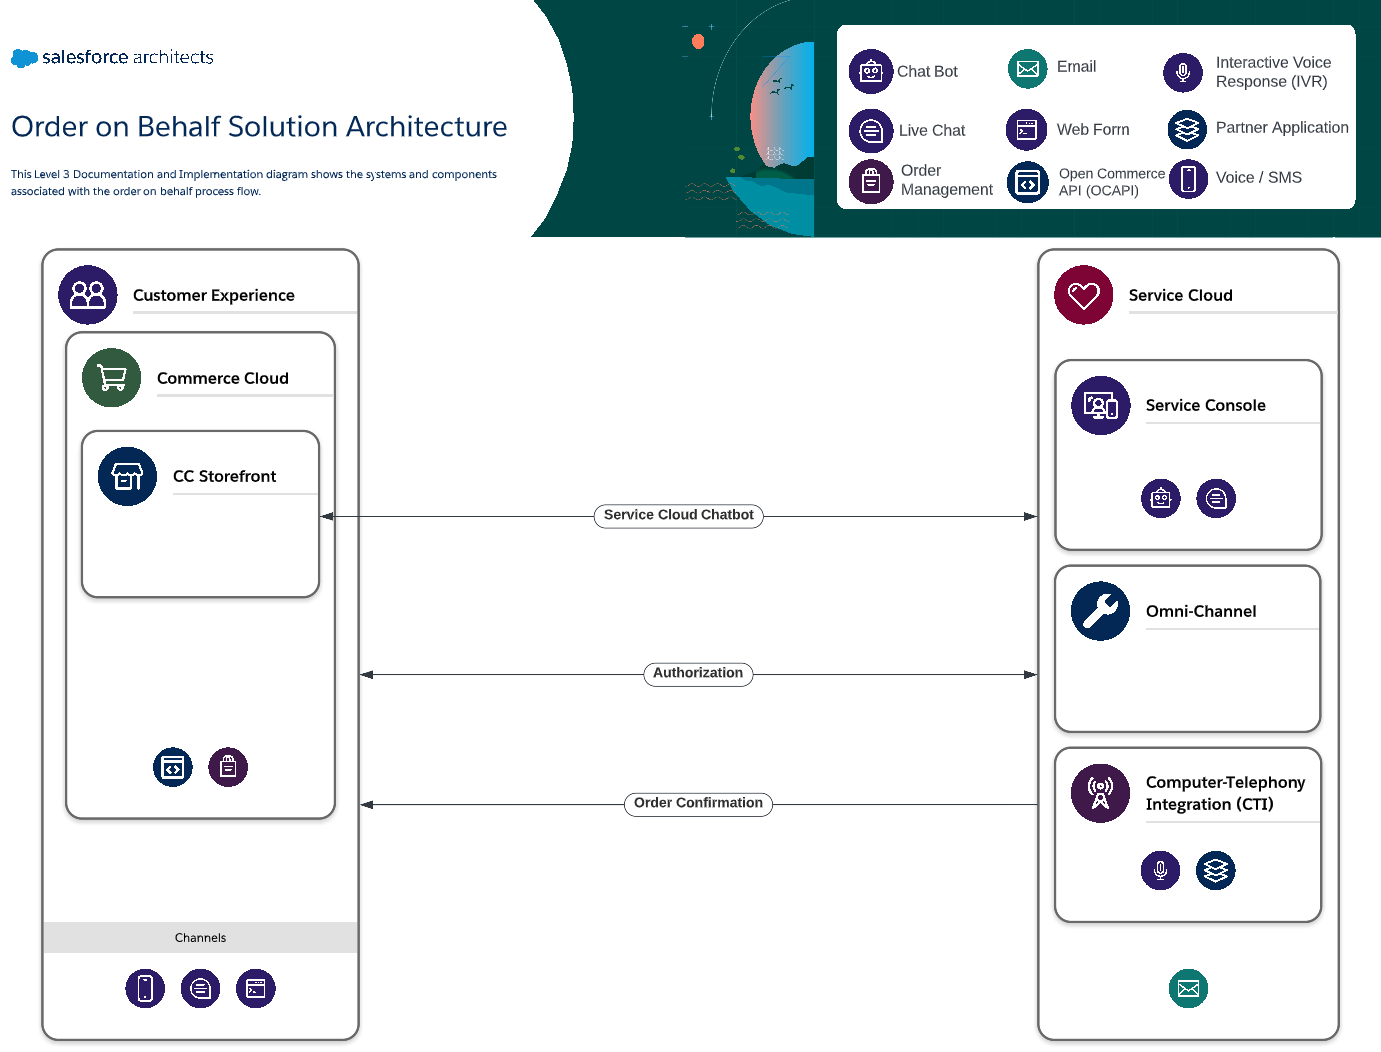
Diagrams at this level show more fine detail than diagrams at either of the levels above. These diagrams show a limited view of the products or technologies in a solution, in order to effectively show more complex detail. Diagrams at Level 3 might show time-based interactions or data flows, or system interactions required to support a process.
In our B2C commerce example, the Level 3 diagram shows an order on behalf process flow. Only products or technology directly involved in the process appear, along with greater detail about the order of the steps and behavior of the flow.
 Open in Lucidchart (Lucidchart account required)
Copy template in Google Slides format (Google account required) Download template in PowerPoint (.pptx) format

Level 4: The Double Click
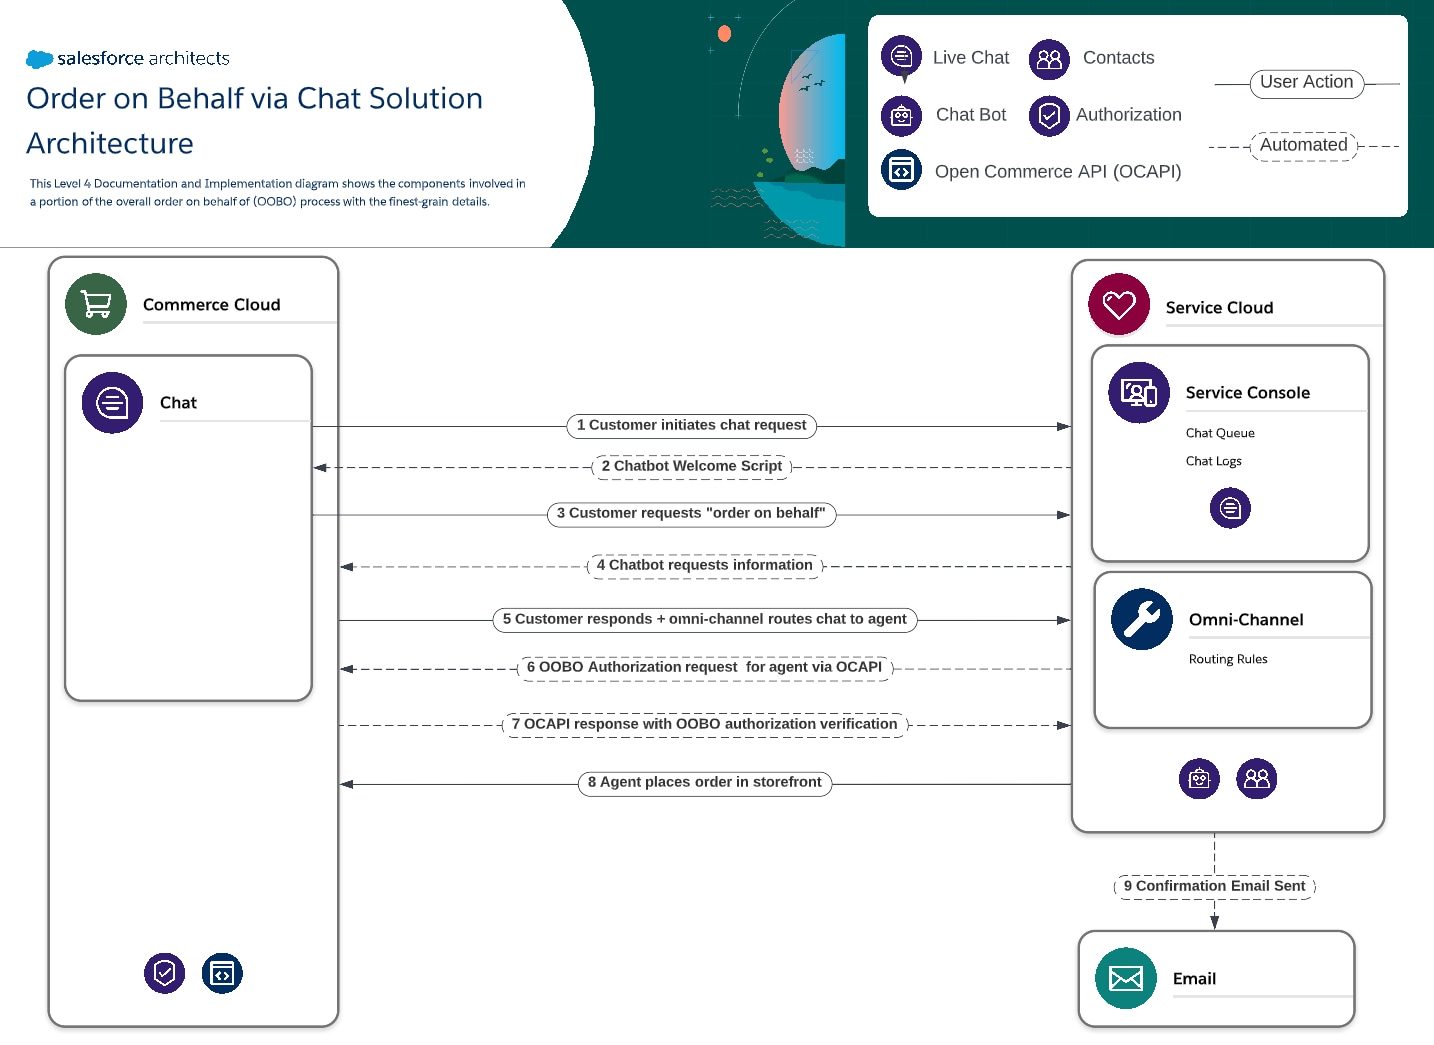
Diagrams at this level show the most specific detail about a piece of a solution or system. This level is the most effective at showing fine-grained technical specifications or requirements. Level 4 diagrams should be the most limited in terms of product or technical scope, so the greater level of detail shown is still understandable for a viewer.
Continuing with our B2C commerce example, the Level 4 diagram shows an order on behalf via chat process flow. In the example below, you'll see the components involved in this portion of the overall order on behalf process, along with the finest grain details.
 Open in Lucidchart (Lucidchart account required)
Copy template in Google Slides format (Google account required) Download template in PowerPoint (.pptx) format
